
Five Minutes with Kerrie Warne: Data-Driven Decisions Drive Performance Improvement—and a Whole Lot More
In this installment of “Five Minutes with…” guest interviewer
Kim Goin talks to Kerrie Warne, Director of St. Alexius NewStart Program at St. Alexius Hospital in St. Louis, Missouri, about how she used data-driven performance techniques to evaluate and improve her bariatric program.
by Kim Goin and Kerrie Warne
Ms. Warne is the Director of St. Alexius New Start Bariatric Program, St. Louis, Missouri. Ms. Goin is a member of the Allergan Bariatric Practice Advisor (BPA) team based in Mundelein, Illinois.
Funding: No funding was provided for the preparation of this article.
Disclosures: Ms. Warne reports no conflicts of interest relevant to the content of this article. Ms. Goin is a member of the Allergan Bariatric Practice Advisor (BPA) team, Allergan, Inc., Irvine, California.
Bariatric Times. 2012;9(1):24
Do you know where your patients are in your conversion process at any given time? In any business, it is imperative to monitor productivity and overall performance to ensure goals are continuously being met. This is particularly vital in bariatric surgery programs where staff is responsible for assisting patients through a complex presurgical process. Each touch point in the process is an opportunity for patients to get “lost,” and if patients are not being adequately tracked through each stage, it is impossible to identify areas needing improvement.
While there are several ways to track and monitor bariatric patients, a successful program in the Midwest has developed a reliable, low-cost tracking method based on the collection of objective data that increases employee productivity, improves staff morale, and generates overall business growth.
One Program’s Experience
Meet Kerrie Warne, Program Director for St. Alexius NewStart™, a large bariatric program in St. Louis, Missouri. Although the St. Alexius program was seeing reasonable growth, Kerrie felt there was additional opportunity to refine the process and improve program efficiency.
I interviewed Kerrie about her experience with evaluating the program and implementing data-driven management at St. Alexius New Start. The following is our question-and-answer-session.
KG: How did the idea of data-driven performance management come about?
KW: When I took over the bariatric program at St. Alexius Hospital two-and-half years ago, I had more than 11 years of experience in management and marketing. However, I had no experience working in a bariatric program. I had no knowledge of Centers of Excellence and only a vague idea of the many unique challenges of this specialty. I quickly realized that I needed a way to better manage the process of getting patients from a phone call to the operating room.
My Allergan Bariatric Practice Advisor introduced me to the Lap-Band® Conversion Tracker, which utilizes process data to drive improvement. The Conversion Tracker includes a funnel chart to produce and show conversion metrics during each step of the process. I immediately thought about using the funnel concept to create individual process funnels for each of my employees, hoping it might give them additional insight into their contribution to the overall process and generate ideas around improvement.
KG: How did you introduce this process?
KW: First, I asked employees to submit a weekly customized report to me that summarized their individual productivity. There were a few issues with this approach. At first, the employees did not understand why we were doing this, and as a result, they did not buy into the process. Additionally, the reports did not contain all of the data I was anticipating. For example, our patient advocate’s reports included numbers of outgoing and incoming calls, seminar attendees, completed consults, and charts submitted to the nurse. However, she was not reporting the number of patients scheduled for a consult that did not complete a consult. Although the data I was receiving helped me focus on some areas that needed improvement, I was still having difficulty identifying the biggest opportunities, which, in this example, was a high dropout rate from scheduled consult to completed consult. I began to suspect the problem might stem from a lack of clarity around staff roles and responsibilities. This situation prompted me to ask the following: “What is the expectation for each staff position?” and “What are the key deliverables from each employee?”
Once I was able to define the key expectations and deliverables for each position, I reviewed corresponding job descriptions to ensure that roles and responsibilities were aligned with these expectations. What I found was surprising; not only were there responsibilities in the job descriptions that did not align with the desired results, but in at least one case, the job title did not even align with the duties being performed. After going through this exercise, I was not surprised that I had not been getting the results I was expecting from my staff.
KG: Once you identified the misalignment between the job descriptions and position expectations and goals, what did you do next?
KW: Accurately updating job descriptions was my next step. Each job description was reviewed and, where needed, updated for appropriate titles, position responsibilities, and pay scale. It quickly became clear that there were some tasks that no one was accountable for that needed to be added to the appropriate job descriptions. My suspicion was that this lack of clarity created confusion, negatively impacted staff morale, and produced stumbling blocks related to moving patients through the process. Once each individual had clarity around roles and responsibilities, the confusion disappeared, morale improved, and we began to work more effectively as a team.
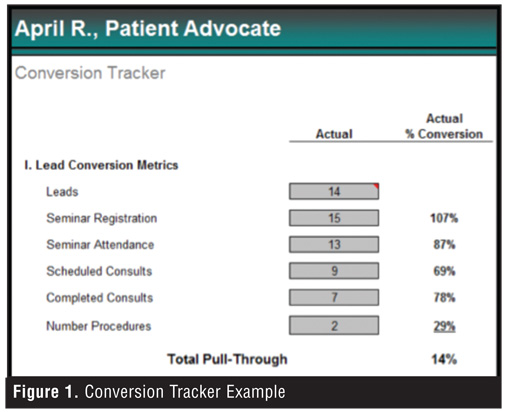
With job descriptions updated and staff members having a clearer understanding of each position’s duties and expectations, I created a customized funnel for employees that outlined the key steps in their individual process. This gave us the ability to track and monitor conversion rates as they related to the specific duties for each employee. For example, the patient advocate is responsible for taking all incoming calls and e-mails, scheduling patients for seminars, taking attendance at seminars, and obtaining insurance approval, so her process funnel (Figure 1) required that she enter metrics for each of these stages. The calls and e-mails are recorded as “Leads,” the patients that schedule for seminars are entered as “Seminar Registrations,” patients that attend a seminar are entered as “Seminar Attendance.”
As you can see in Figure 1, this funnel calculates the conversion rate at each step in the process, allowing the employee and manager to monitor productivity and patient pull-through.
KG: Please describe the steps you take to evaluate employee data.
KW: Once I receive the individual process funnels, I review and analyze the data. Initially, I assess each individual funnel separately, looking for trends in the current report and in the year-to-date reports. This information is discussed during weekly conversations with each employee to review job performance and process pull-through.
Next, all of the data is rolled into an overall program funnel that shows conversion rates from initial lead to surgery. My process is as follows:
• I pull information from each employee and account for external factors, such as calls or leads that are coming in through the surgeon’s office, to fill in the overall program conversion metrics.
• Once all of the data is aggregated into the program funnel, I compare the current metrics to a baseline, which is determined by reviewing historical data to calculate an average for each step. The baseline gives me perspective on how we have done in the past and provides a starting point to measure against. The comparison between the current month’s data and the baseline allows me to look for trends in the current data to identify areas of opportunity. For example, if I notice that the conversion rate from seminar registration to seminar attendance is down, I would look to our patient advocate who is responsible for moving patients to seminar. I would examine her individual process funnel to look for areas of improvement that might impact the seminar attendance conversion rate.
• I also use the data to help set realistic goals for each step in the process. For example, if I determine that the baseline conversion rate in a certain step is ten percent, it may not be realistic to expect an immediate jump to 50 percent. I could, however, set a more reasonable goal to achieve gradual improvement over time.
• Lastly, I look at certain key metrics from each employee to monitor the performance of the program as it relates to other factors (besides conversion metrics). For example, I look at our surgery scheduler’s funnel to see how many patient charts have been received because we know that these patients should be added to the surgery schedule in the next 4 to 6 weeks. This helps me predict what the surgical volume should look like in the coming months.
KG: Has your conversion tracking system proven to be valuable in many areas affecting productivity?
KW: Yes, it certainly has, although it is important to keep in mind that this system is not the solution. It is a tool that allows managers to analyze data and ask the right questions, identify areas for improvement, and successfully implement change.
KG: How did the implementation of a process funnel for each employee impact your staff?
KW: By better defining their roles, staff gained clarity on what was expected of them. By introducing the process funnel, staff members have gained greater control over their job performance through increased visibility and accountability. The weekly meetings have given staff the opportunity to have frequent, honest discussions about their process that empower them to be a part of the solution. Overall, it greatly improved morale by giving each staff member the opportunity to demonstrate success through conversion improvement.
KG: How has this data-driven management approach improved your program?
KW: I find that this process has positively impacted almost every person and every aspect of the program including employees, management, patients, and surgeons. Some of the benefits I have witnessed include the following:
• Patients. More efficient, streamlined process; decrease in the amount of time from seminar to surgery; improved patient satisfaction
• Program management and administration. Increase in employee job satisfaction; accountability shift from administration to employee; improved productivity; objective performance management
• Surgeons. Improved patient access to care; increase in surgical volume; consistent processes and procedures.
KG: Drawing from your experience, what key take-away points can you share with other program administrators who would like to implement this process?
KW: Other bariatric programs wanting to successfully implement a similar process should consider the following five steps:
1. Collaborate with the staff to ensure all responsibilities and job descriptions are aligned. If they are not, update them. This empowers the staff and creates ownership.
2. Determine the main deliverables for each position. These deliverables will become the foundation for a customized funnel.
3. Use the funnel approach as the basis for weekly employee meetings and focus on current issues and opportunities for improvement.
4. Roll the individual funnels into one for better overall management of your program.
5. Continue to focus on the data to drive process improvement and overall conversion rates.
KG: It sounds like you are happy with your results; do you have any final words of wisdom?
KW: Opportunities for improvement become crystal clear when objective data is the foundation of your decisions. I no longer waste time wondering what I should do to improve the process. Instead, I look at the conversion rates and focus my energy on the opportunities for improvement and growth. In addition to the benefits that I have shared, our surgeon and hospital satisfaction levels have improved, we have experienced a decrease in staff performance issues that require counseling, and we have seen a 37-percent increase in our overall conversion rate.
Category: 5 Minutes With..., Past Articles
Subscribe
If you enjoyed this article, subscribe to receive more just like it.
